AWS Job
Overview
AWS job allows you to copy Amazon Web Services CloudWatch statistics into Axibase Time Series Database for long-term retention, reporting, and visualization.
Refer to AWS documentation for a complete list of available metrics.
The AWS job stores markers for each CloudWatch metric so that API requests are incremental and load only the most recent data. These markers allow the job to build optimized queries and to avoid data gaps in case of network outages.
Each job can be configured to execute multiple configurations in order to retrieve metrics from different regions. The configurations are processed sequentially within each job iteration.
When an AWS job is started for the first time, it will load available historical data from CloudWatch, available for up to 2 weeks.
Supported Namespaces
Each AWS namespace provides a set of metrics available for resources of a particular type.
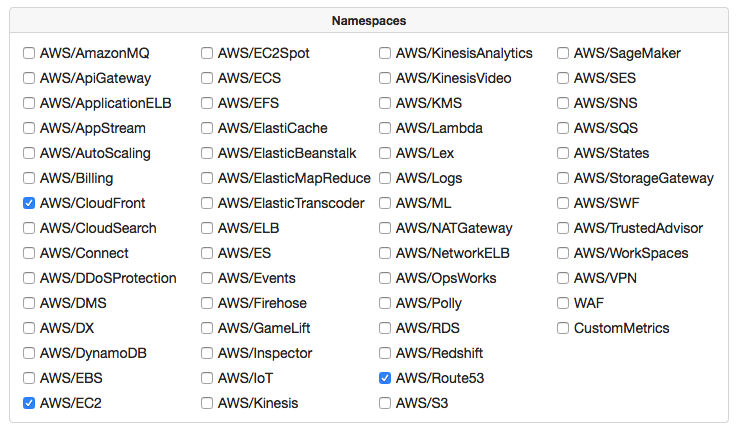
You can configure the AWS job to collect metrics for all or a subset of namespaces. To minimize the number of API queries, choose to collect data only for AWS services that you're actually using.
Available namespaces:
Schema
The CloudWatch metrics are stored in ATSD using the following naming convention:
{namespace}.{metric-name}.{statistic-name}
The composite metric name is normalized by replacing slash and whitespace symbols with underscores.
aws_ebs.volumeidletime.maximum
For each metric, the AWS job retrieves the following period statistics:
- average
- minimum
- maximum
- sum
- sample count
The AWS statistics are stored in ATSD as metrics which means that ATSD can compute aggregate statistics on top of AWS statistics.
For example, the AWS/Billing Estimated Charges metric is stored as 5 metrics:
aws_billing.estimatedcharges.minimumaws_billing.estimatedcharges.maximumaws_billing.estimatedcharges.sumaws_billing.estimatedcharges.averageaws_billing.estimatedcharges.samplecount
The number of metrics within each namespace varies greatly. For AWS/EC2 the list consists of 15+ metrics.
The job assigns each metric to an entity which is determined based on the primary dimension.
Configuration Settings
| Field | Description |
|---|---|
| Name | Configuration name. |
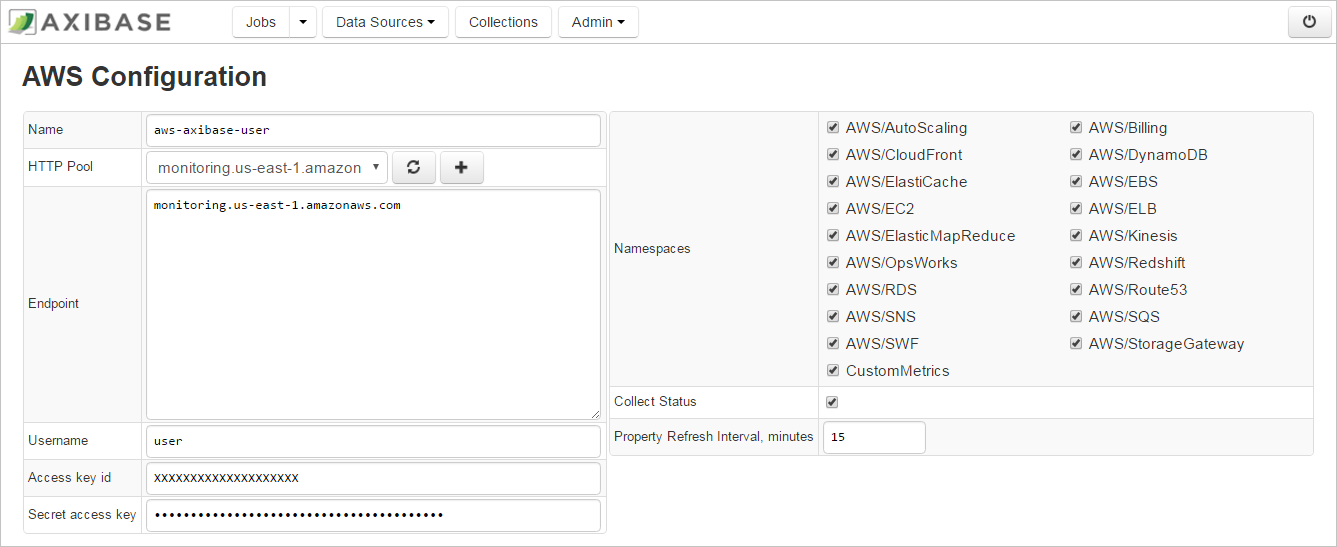
| HTTP Pool | Pool of https connections to execute requests against the specified CloudWatch endpoint. The pool can be left empty. |
| Endpoint | CloudWatch Endpoint URL. |
| Access key id | Access key. See Getting Your Access Key ID and Secret Access Key. |
| Secret access key | Secret access key. |
| Namespaces | CloudWatch metric namespaces enabled for collection. |
| Collect Status | Collect status check metrics such as StatusCheckFailed, StatusCheckFailed_Instance, StatusCheckFailed_System |
| Property Refresh Interval, minutes | Interval for loading resource attributes. |
Configuration Steps
- Create a read-only IAM account for querying CloudWatch statistics.
- Open the Jobs:Add Job:Use Wizard page.
- Specify access and secret keys.
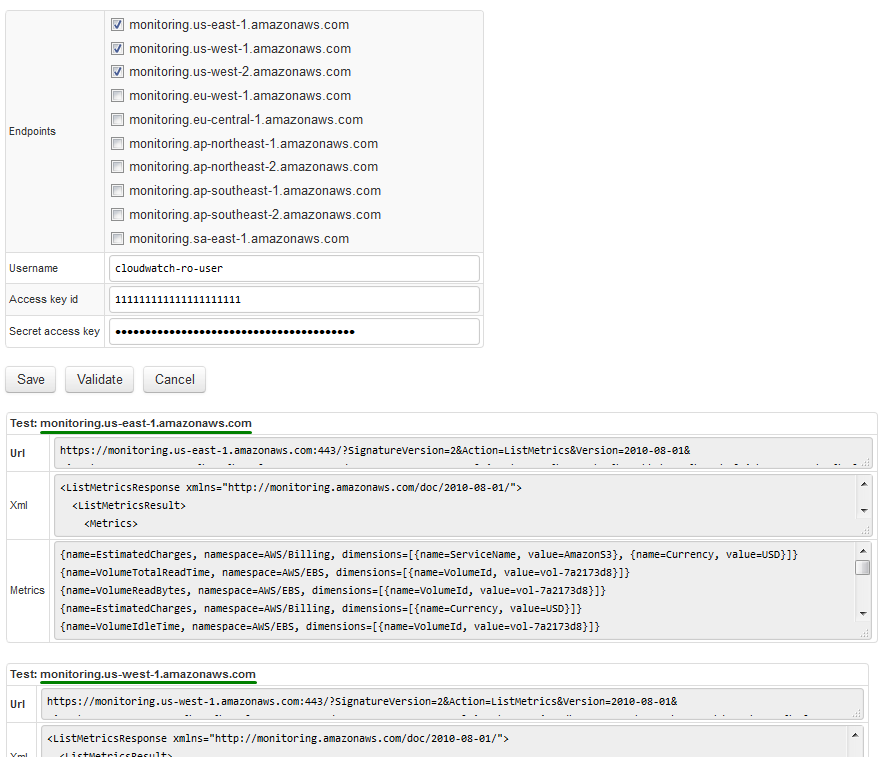
- Select AWS regions from which you want to collect data.
The wizard will create a separate AWS configuration for each region within the same job. - Validate the credentials and save the job if there are no errors.
- Select one of the created configurations and click Test.
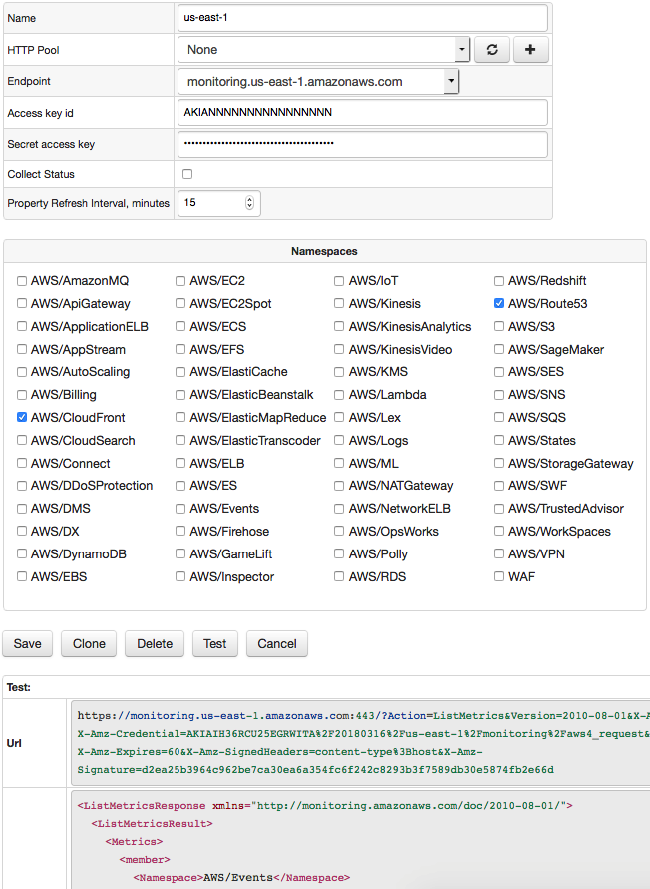
- To view available metrics for a particular namespace, uncheck all namespaces except one and click Test.
Validation
- Open the AWS job page and set the schedule to
R 0/5 * * * ?to execute the job every 5 minutes with random seconds. - On the AWS Jobs list page, check that Items Read and Commands Sent are greater than 0.
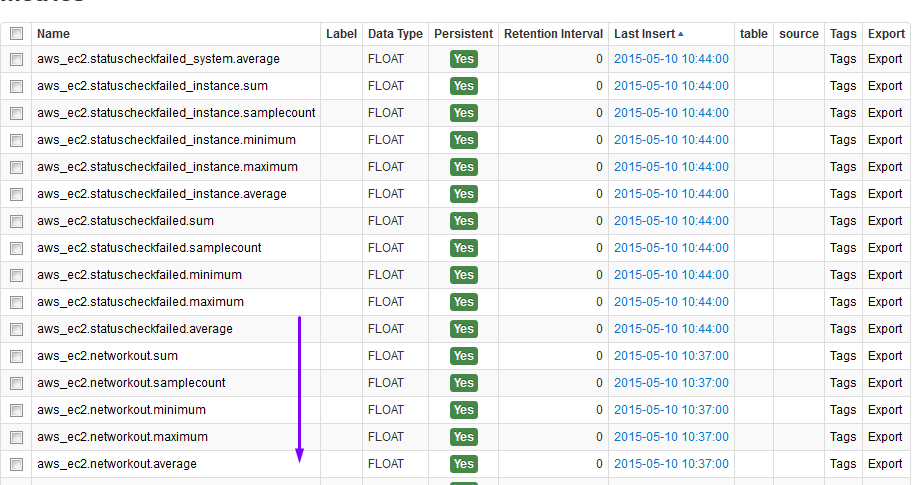
- Login into ATSD. Open the Metrics tab and review available metrics by typing
awsinto the Name Mask.
Note that it may take the AWS job a while to load backlogged historical data for all metrics after the job was created. - Open the Entities tab and locate one of AWS EC2 instances. Click on Portal links to access pre-defined AWS portals.
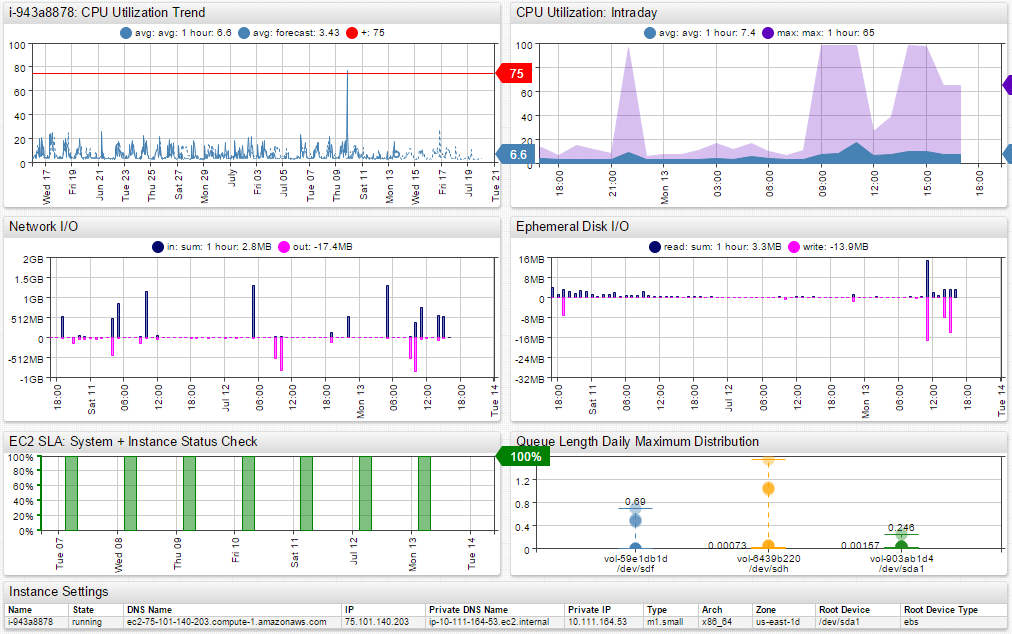
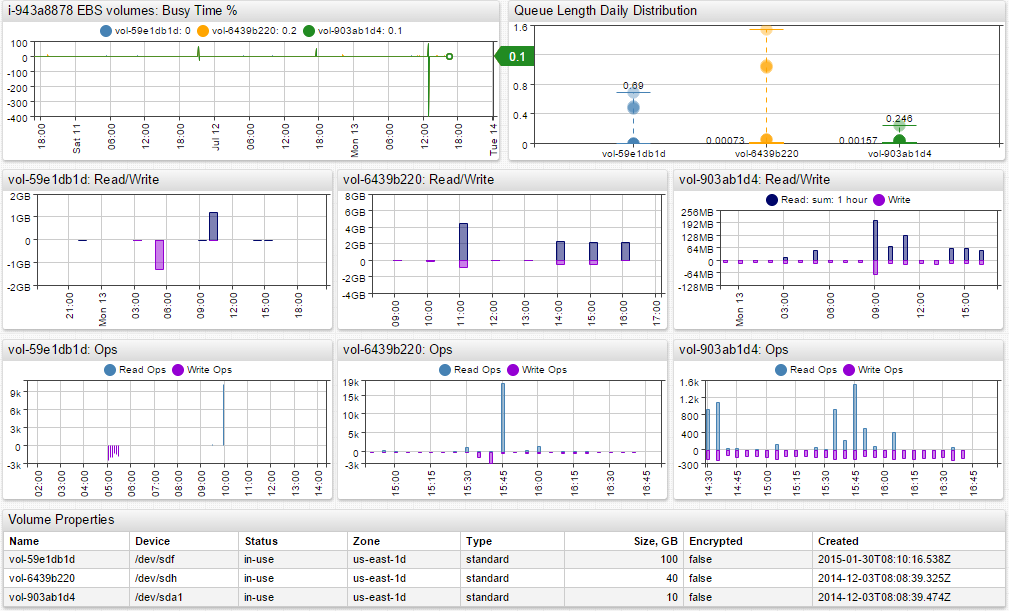
Sample Dashboards
Configuration Example
Sample AWS/EC2 CloudWatch Metrics
- aws_ec2.cpucreditbalance
- aws_ec2.cpucreditusage
- aws_ec2.cpuutilization
- aws_ec2.diskreadbytes
- aws_ec2.diskreadops
- aws_ec2.diskwritebytes
- aws_ec2.diskwriteops
- aws_ec2.networkin
- aws_ec2.networkout
- aws_ec2.networkpacketsin
- aws_ec2.networkpacketsout
- aws_ec2.statuscheckfailed
- aws_ec2.statuscheckfailed_instance
- aws_ec2.statuscheckfailed_system
AWS CloudWatch API Fees
AWS applies usage charges for CloudWatch API requests with free entitlement available on a monthly basis.
An extra fee is charged for detailed monitoring, as well as for custom metrics. The detailed monitoring provides 1-minute period granularity and a lower delay, typically 1 or 2 minutes, whereas the basic monitoring can have a delay between 5 and 10 minutes.
Namespace Dimensions
The primary dimension determines entity name in ATSD.
| Namespace | Primary Dimension |
|---|---|
| AWS/Route53 | HealthCheckId |
| AWS/ApiGateway | ApiName |
| AWS/AppStream | Fleet |
| AWS/AutoScaling | AutoScalingGroupName |
| AWS/Billing | ServiceName |
| AWS//CloudFront | DistributionId |
| AWS/CloudSearch | ClientId |
| CWAgent | InstanceId |
| AWS/Events | RuleName |
| AWS/Logs | LogGroupName |
| AWS/Connect | InstanceId |
| AWS/DMS --> extract id or arn | |
| AWS/DX | ConnectionId |
| AWS/DynamoDB | TableName |
| AWS/EC2 | InstanceId |
| AWS/EC2Spot | AvailabilityZone |
| AWS/ECS | ClusterName |
| AWS/ElasticBeanstalk | InstanceId |
| AWS/EBS | VolumeId |
| AWS/EFS | FileSystemId |
| AWS/ELB | LoadBalancerName |
| AWS/ApplicationELB | LoadBalancerName |
| AWS/NetworkELB | LoadBalancer |
| AWS/ElasticTranscoder | PipelineId |
| AWS/ElastiCache | CacheClusterId |
| AWS/ES | ClientId |
| AWS/ElasticMapReduce | JobId |
| AWS/GameLift | FleetId |
| AWS/Inspector | ??? |
| AWS/IoT | RuleName |
| AWS/KMS | KeyId |
| AWS/KinesisAnalytics | Flow |
| AWS/Firehose | DeliveryStreamName |
| AWS/Kinesis | StreamName |
| AWS/KinesisVideo | StreamName |
| AWS/Lambda | FunctionName |
| AWS/Lex | BotName |
| AWS/ML | MLModelId |
| AWS/OpsWorks | InstanceId |
| AWS/Polly | Operation |
| AWS/Redshift | NodeID |
| AWS/RDS | DBInstanceIdentifier |
| AWS/Route53 | HealthCheckId |
| AWS/SageMaker | Host |
| AWS/DDoSProtection | |
| AWS/SES | |
| AWS/SNS | Application |
| AWS/SQS | QueueName |
| AWS/S3 | BucketName |
| AWS/SWF | Domain |
| AWS/States | *arn |
| AWS/StorageGateway | GatewayName |
| AWS/NATGateway | NatGatewayId |
| AWS/VPN | VpnId |
| WAF | Rule |
| AWS/WorkSpaces | WorkspaceId |
| AWS/AmazonMQ | Topic |
| AWS/TrustedAdvisor | ServiceName |
