Tomcat Servlet Container
Overview
This document describes how to collect JMX metrics exposed by Apache Tomcat Servlet Containers for long-term retention and monitoring in Axibase Time Series Database.
Requirements
- Apache Tomcat
6+
Installation Steps
Enable JMX in Java Application
Configure your Java for JMX monitoring as described here.
Import Tomcat job into Axibase Collector
- Open Jobs:Import and upload the job file depending on the version of your servlet container engine:
- Catalina
- Standalone
Configure Tomcat JMX Connection
- Open the Jobs:JMX page and select the
jmx-tomcatjob. - For each JMX Configuration:
- Provide connection parameters to the target Tomcat:
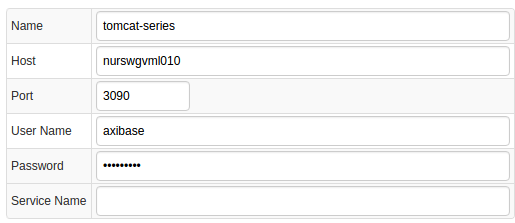
- Click the [Test] button and make sure that the result is similar to the below screenshot:

Schedule the Job
- Open the
JMX Jobpage and click the [Run] button for the Tomcat JMX job. - Make sure that the job status is
COMPLETEDandItems ReadandSent commandsare greater than 0.

- If there are no errors, set job status to 'Enabled' and save the job.
Verify Metrics in ATSD
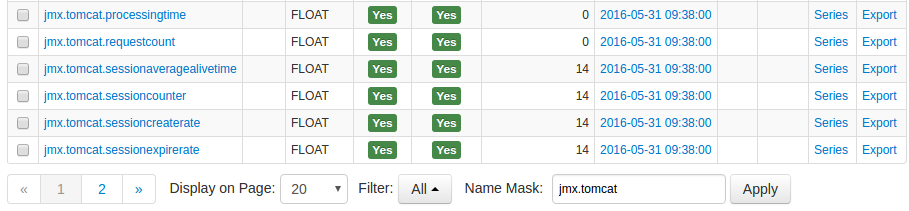
- Log in to ATSD.
- Click on the Metrics tab and filter metrics by name
jmx.tomcat*.
Viewing Data in ATSD
Metrics
- List of collected Tomcat metrics
Properties
- List of collected Tomcat properties
Entity group
- Open Admin:Entity Groups, click the [Import] button, and upload tomcat_entity_group.xml.
- Select the imported
apache-tomcatgroup. - Verify that the group contains your Tomcat hosts.
Entity Views
- Open Configuration:Entity Views, click the [Import] button, and upload tomcat_entity_view.xml.
- Select the imported
Apache Tomcat Containersview. - Select the Entity Group that you created earlier.
- Click on the [View] button and browse information about your entities:

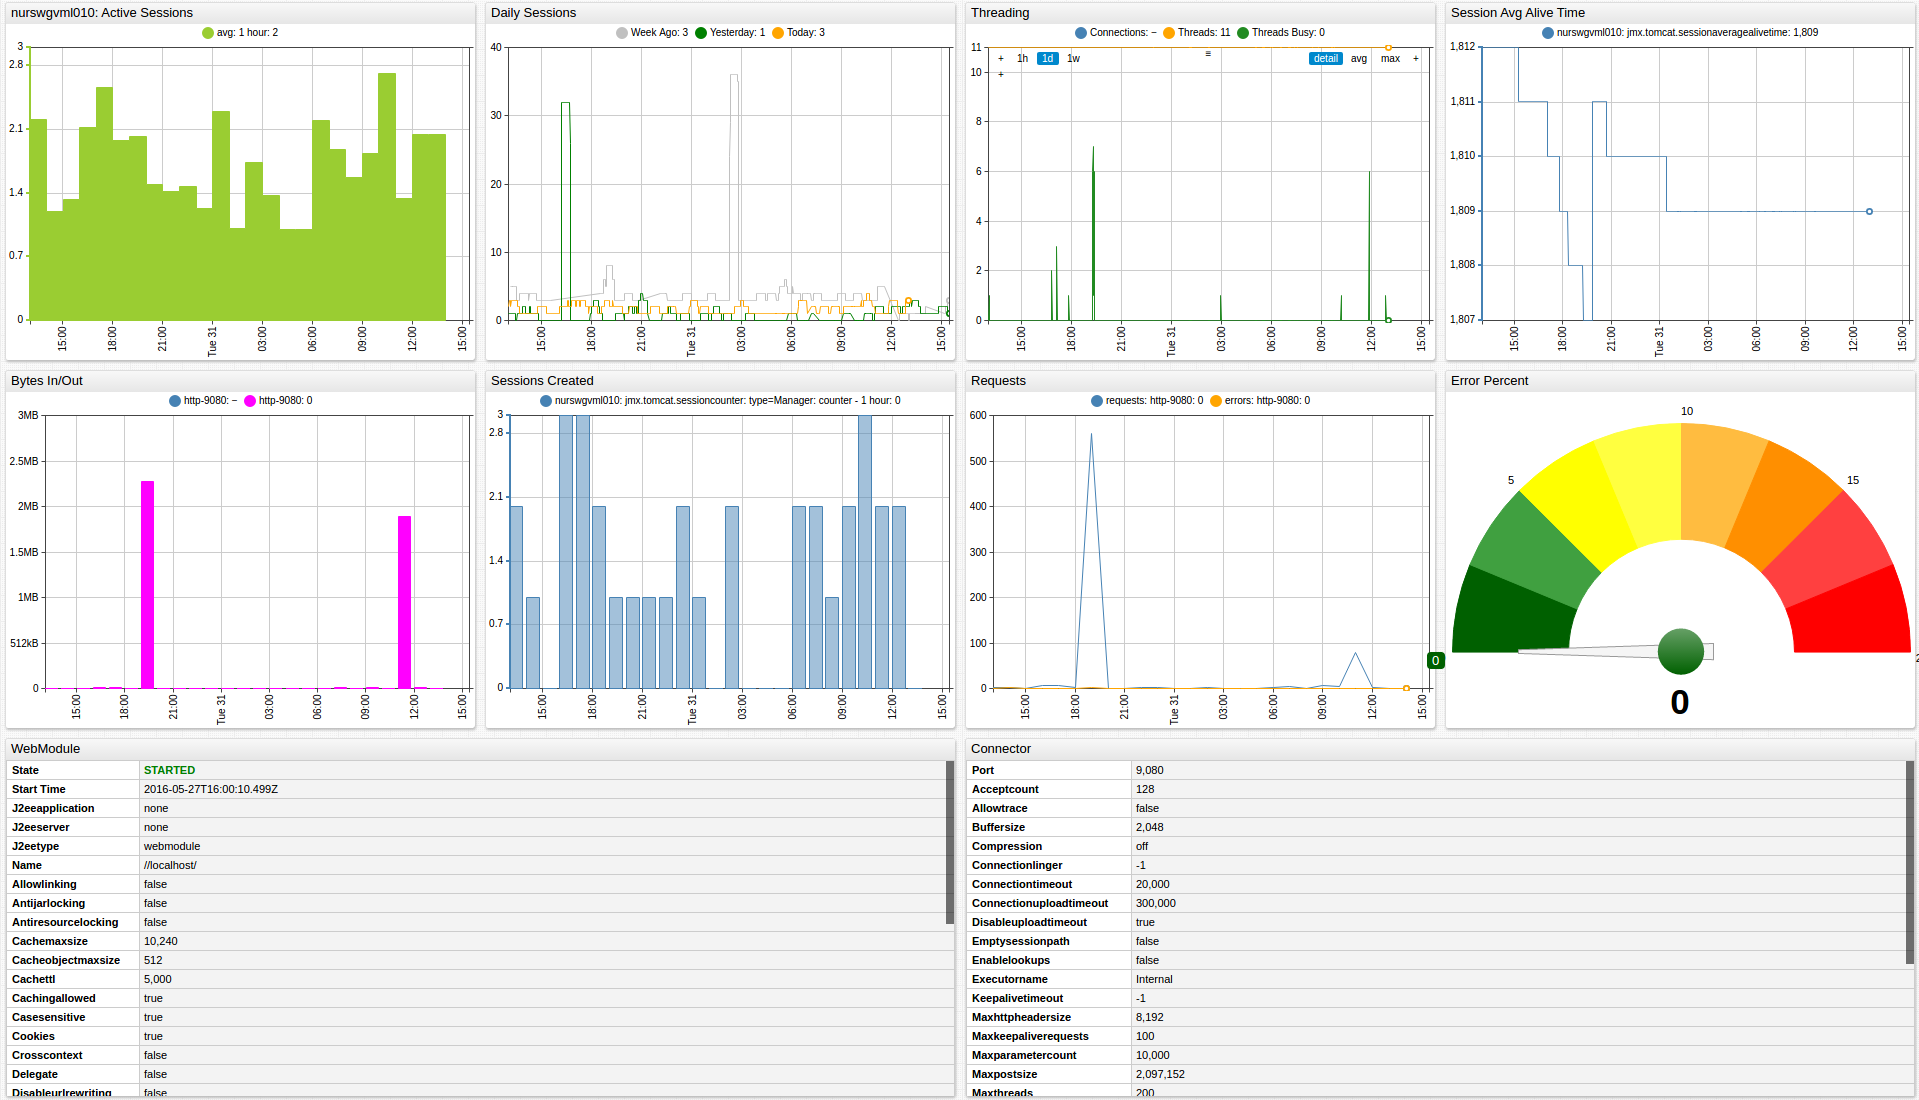
Portal
- Open Configuration: Portals, click the [Import] button, and upload tomcat_portal.xml.
- Click the Assign link and associate the portal with the entity group you created earlier.
- Open Entity tabs, find the java application by name, and click on its portal icon.
![]()