MySQL Server
Overview
This document describes how to collect global status metrics from performance_schema introduced in MySQL 5.7+ for long-term retention and monitoring in the Axibase Time Series Database.
The process involves enabling a JDBC job in Axibase Collector to poll a global_status table and uploading the counters to ATSD for processing.
Requirements
- MySQL Server
5.7+
Installation Steps
Create a Read-Only Account in the Target MySQL Server
CREATE USER 'axibase-ro'@'collector_host' IDENTIFIED BY '********';
GRANT SELECT ON performance_schema.* TO 'axibase-ro'@'collector_host';
FLUSH PRIVILEGES;
To allow connection from any IP address, use the wildcard for remote address:
CREATE USER 'axibase-ro'@'collector_host' IDENTIFIED BY '********';
GRANT SELECT ON performance_schema.* TO 'axibase-ro'@'*';
FLUSH PRIVILEGES;
Allow External Connection to the Database
Modify mysql.cnf by setting bind-address = 0.0.0.0.
Import MySQL Server Job into Axibase Collector
- Open Jobs:Import and upload the mysql-server-jobs.xml file.
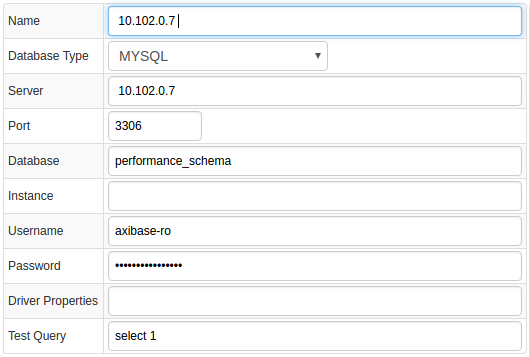
Configure MySQL Server Database Connection
- Open the Data Sources:Databases page and select the
10.102.0.7database. - Provide connection parameters to the target MySQL Server database as displayed below:
- Execute the following test query to check the connection:
SELECT 1
- Query result must be
Query OK.
Verify Job Configuration
- Open MySQL Server job.
- Set Data Source to
10.102.0.7.
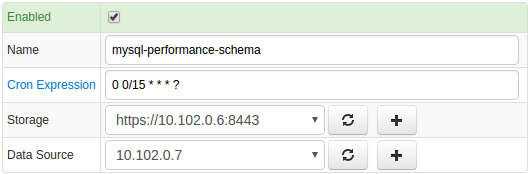
- Choose one of the target ATSD instances if your Collector instance is connected to multiple ATSD servers.
- Save the Job.
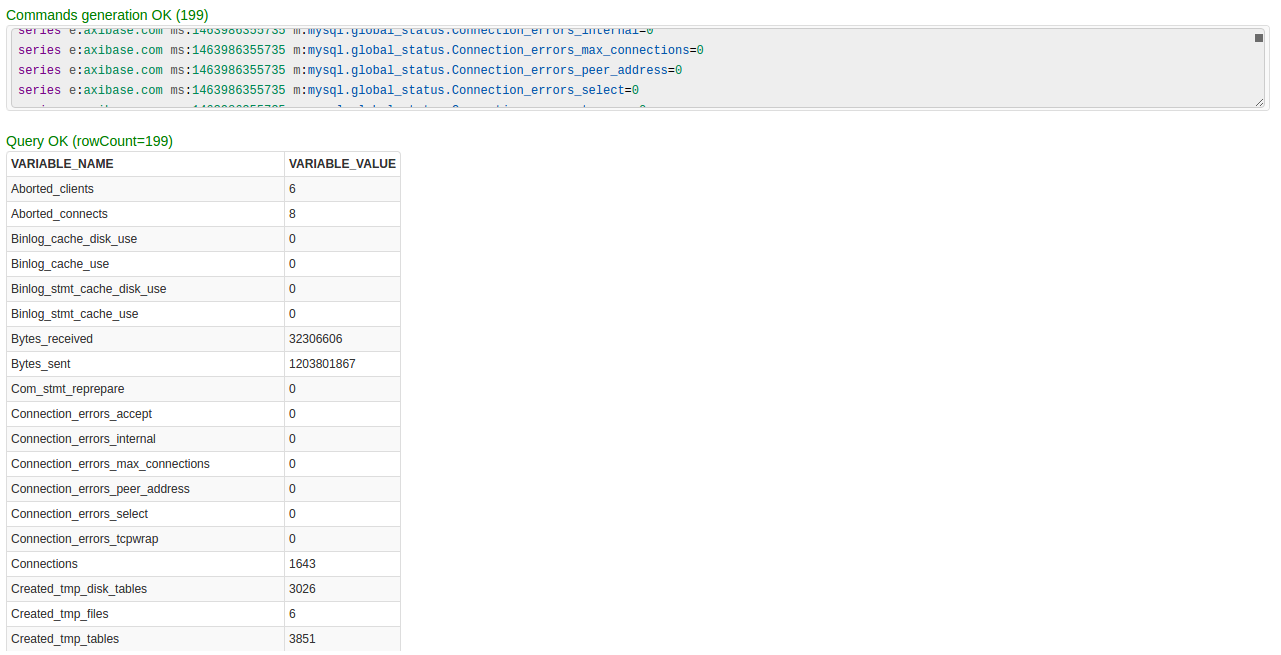
- Open each configuration, click on the [Test] button and review output. See Data Queries below.
Schedule the Job
- Open the
JDBC Jobpage and click the [Run] button for the MySQL Server JDBC job. - Make sure that the job status is
COMPLETEDandItems ReadandSent commandsare greater than 0.

- If there are no errors, set job status to Enabled and save the job.
Verify Metrics in ATSD
- Log in to ATSD.
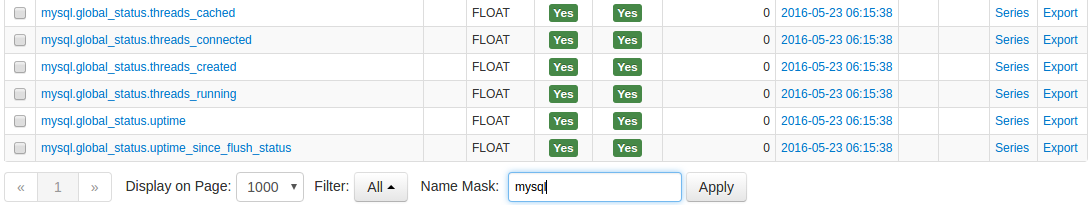
- Click on the Metrics tab and filter metrics by name
mysql.*.
Viewing Data in ATSD
Metrics
- List of collected MySQL Server metrics.
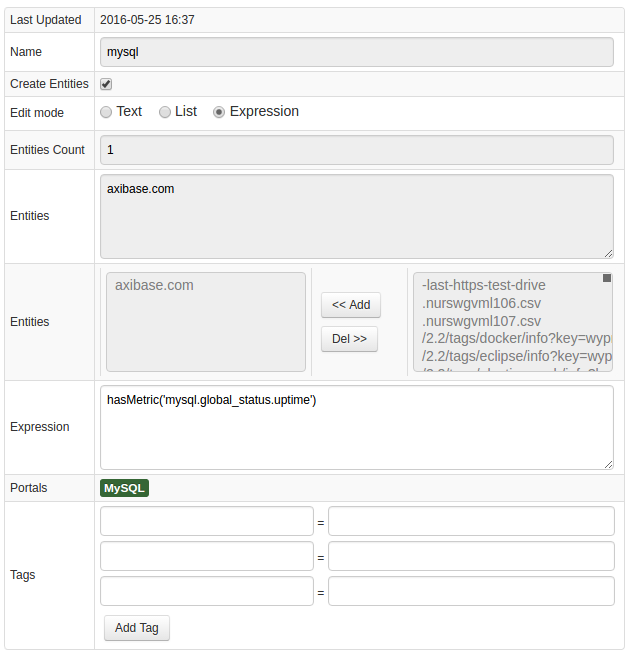
Entity Groups
- Open the Admin: Entity Groups page.
- Create a new Entity Group, click on Expression 'Edit mode', and enter the following expression:
hasMetric('mysql.global_status.uptime')
- Save and verify that the group contains your MySQL database hosts:
Portals
- Open the Configuration: Portals page and import a MySQL portal from portal-mysql.xml.
- Click Assign link and associate the portal with the entity group you created earlier.
- Open Entity tabs, find the mysql database by name, and click on its portal icon.
![]()
MySQL Server Perfomance Live Portal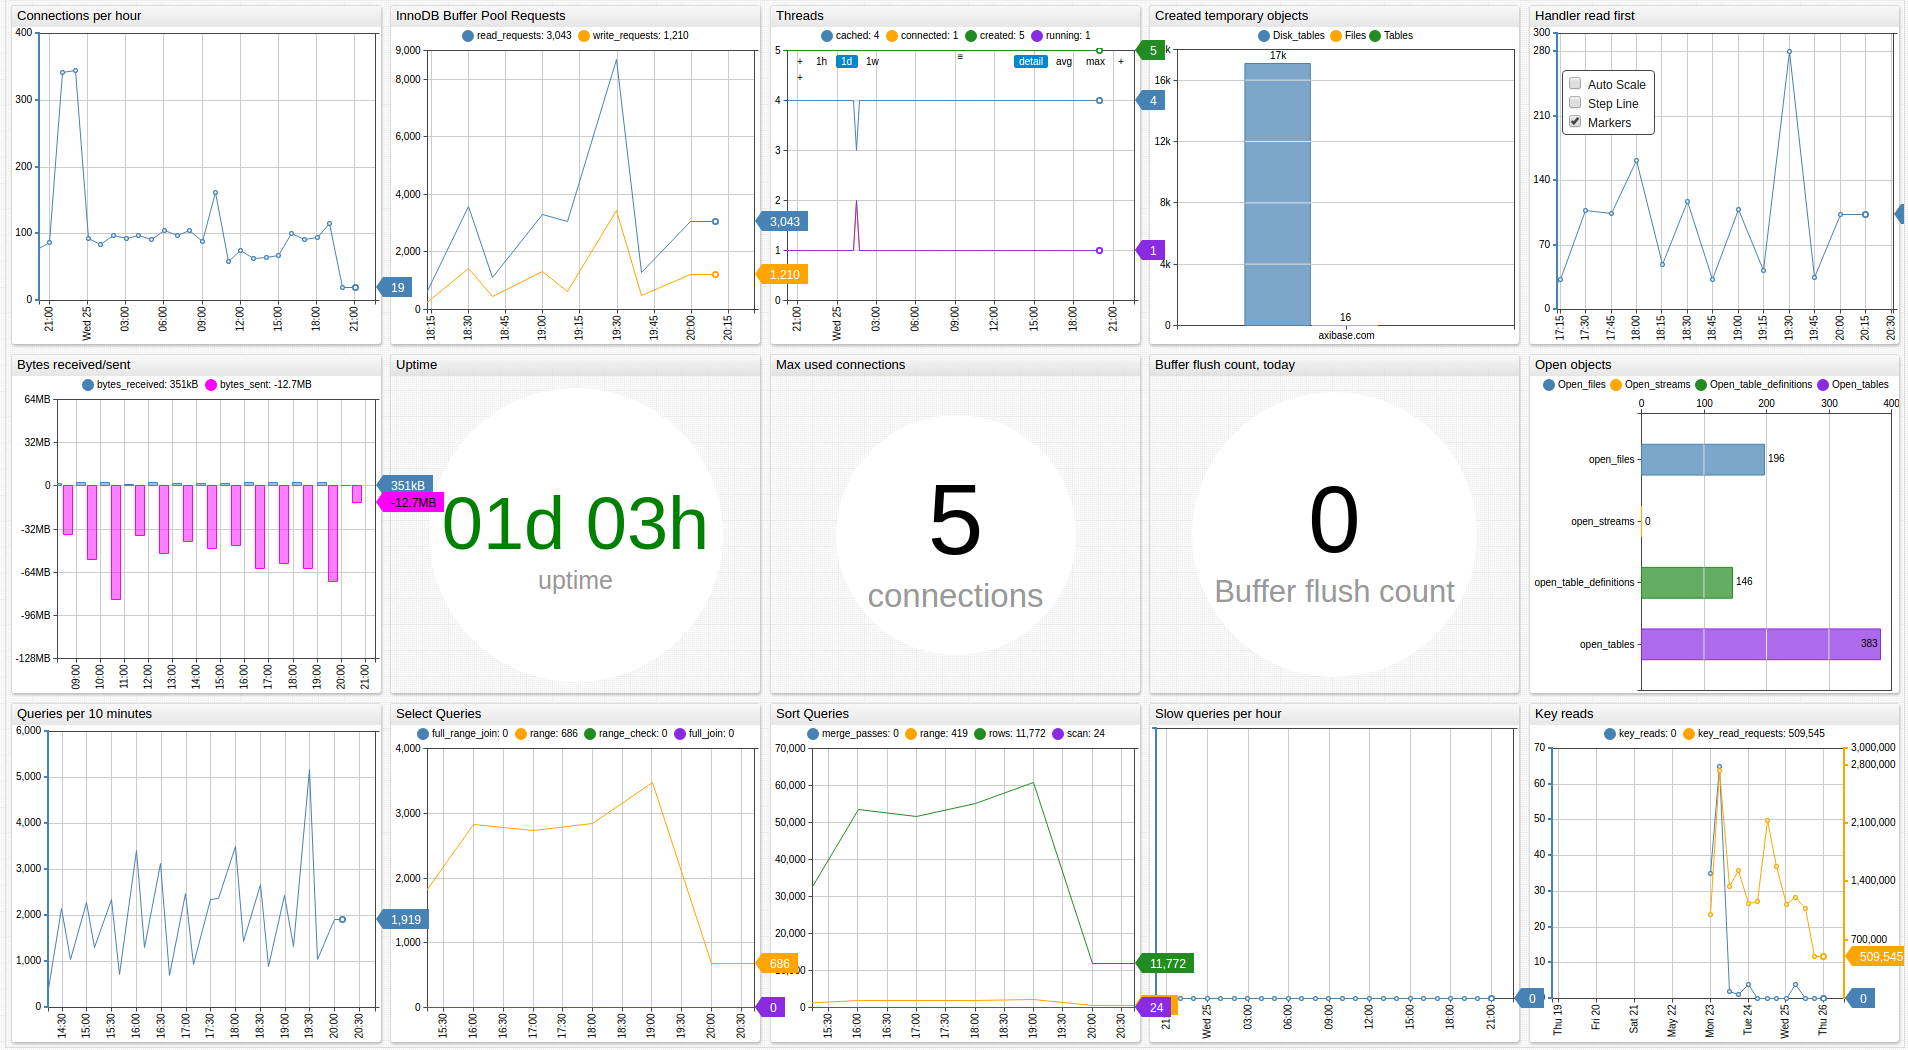
Data Queries
- Metrics Queries select most recent statistics:
SELECT * FROM performance_schema.global_status